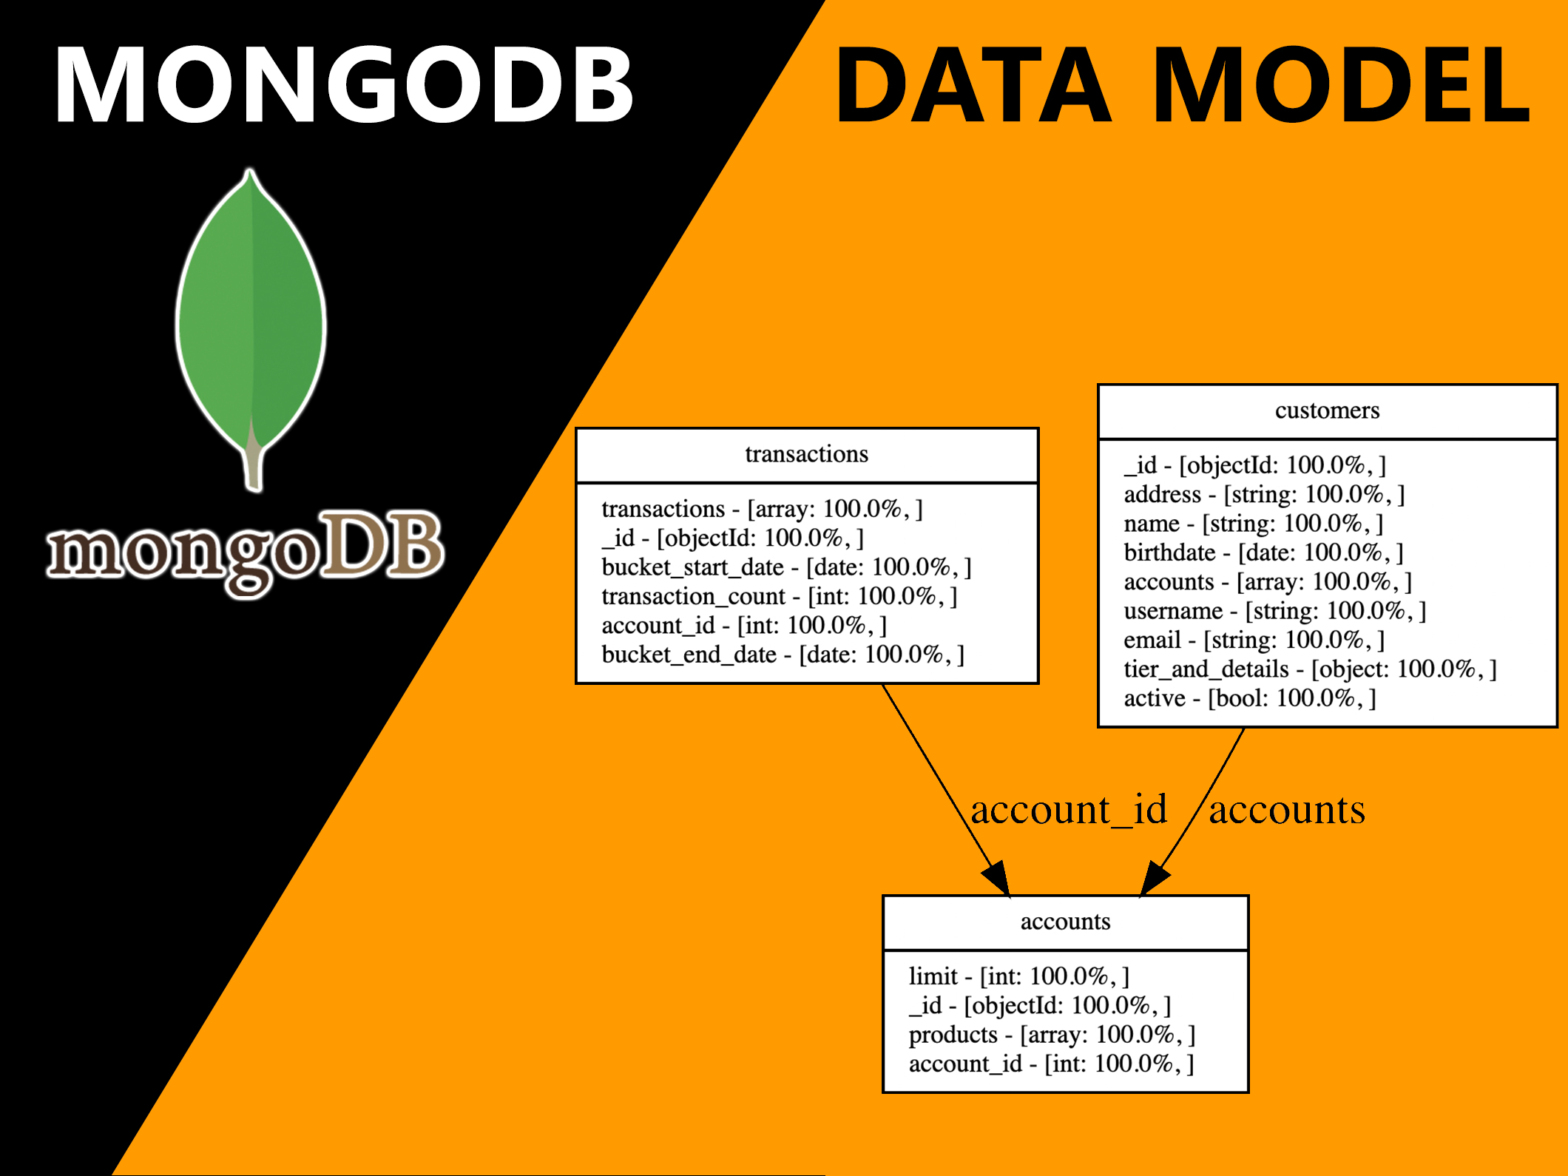
This week’s post will teach you how to shortcut your way through understanding a data model for a MongoDB database, through a simple python script and graphviz to power the visuals.
Recently I had a challenge when trying to rearchitect a data stack using a document database as its main source of data.
Why using document databases?
Document Databases are great options to home denormalised data sets. They enable rapid development for applications that do not have a stable underlying schema. Event-driven and IoT applications are good examples.
Document databases are easy to scale in case of big data, they allow flexible schemas in case you have to deal with diversified data sources and they can host complex data structures, which mimic the same definition they have on the application code.
When do Document Databases fall short?
Document Databases have problems as well. The main drawback is the inability of running complex queries that require multiple documents, from different tables/collections to be joined. Join operations are costly in Document Dabatases, which makes them perform badly in BI and Analytics use cases.
Another result of not being able to do joins efficiently is that the storage patterns for Document Databases typically encourage data duplication for ease of access. This results on a database that is harder to map and manage. The source of record for some data entities becomes less clear. Updating and deleting records becomes hard as multiple tables/collections are impacted.
Why do we need a data model for them?
When Document Databases grow in complexity, inherent relationships between tables/collections are likely to occur. Especially if the Document Database is used to power the entire application. Most applications will have some sort of relational requirements. As more of this requirements pile up, it is possible that a big part of the database has turned into a “fake” relationship database.
Modelling becomes relevant to be able to untangled underlying relationships that are often introduced at an application level. Modelling will help on the onboarding of new developers, the refactoring of database and on recognising patterns that allow for the identification of duplication, excessive complexity or unused data.
Mongo Schema Analyser
To solve the problem I spent some time creating a python script that analyses a document database, in this case a MongoDB database.
On this example we will use Mongo’s analytics sample collection: https://docs.atlas.mongodb.com/sample-data/sample-analytics/
Let’s look at our python script.
First we will connect to our MongoDB and list all the connections:
# connect to the mongoclient
client = pymongo.MongoClient('mongo+srv://<user>:<password>/<URL>?retryWrites=true&w=majority&tlsAllowInvalidCertificates=true')
# get the database
database = client['sample_analytics']
# list the connections
collection_list=database.list_collection_names()
Then we start our output graphviz .dot file:
file_object_dot = open('./relationshipsWTypes.dot', 'w')
file_object_dot.write('digraph G{\n'
                        'node [\n'
                        'fontname = "Bitstream Vera Sans"\n'
                        'fontsize = 8\n'
                        'shape = "record"\n'
                        ']\n'
                        'edge [\n'
                        'arrowtail = "empty"\n'
                        ']\n'
                        )
We will then need a way to list all the possible fields/keys and their respective possible value types to have a better understanding of each collection:
def get_keys(db, collection_name):
    collection=db.get_collection(collection_name)
    return collection.aggregate([
            {
                #get documents as array of keys (k) and values (v)
                "$project":{
                    "data":{
                        "$objectToArray":"$$ROOT"
                        }
                    }
                },
                #to make sure our script does not take forever to run we will sample up to only 1000 documents from each collection
            { "$sample": { "size": 1000 } },
            #Deconstructs the arrays into a single one with all its values
            {"$unwind":"$data"},
            {"$project":{"result":{"value": "$data.v", "key": "$data.k"}}},
            #Groups by key and the value type, counts the unique the key, type pairs
            {"$group":{"_id":{"key":"$result.key",  "type":{"$type": "$result.value"}  }, "count":{"$sum":1}}}
         ])
This is one of the most important parts of the script. We have used Mongo’s aggregation pipeline to group the fields/keys and value types for each collection.
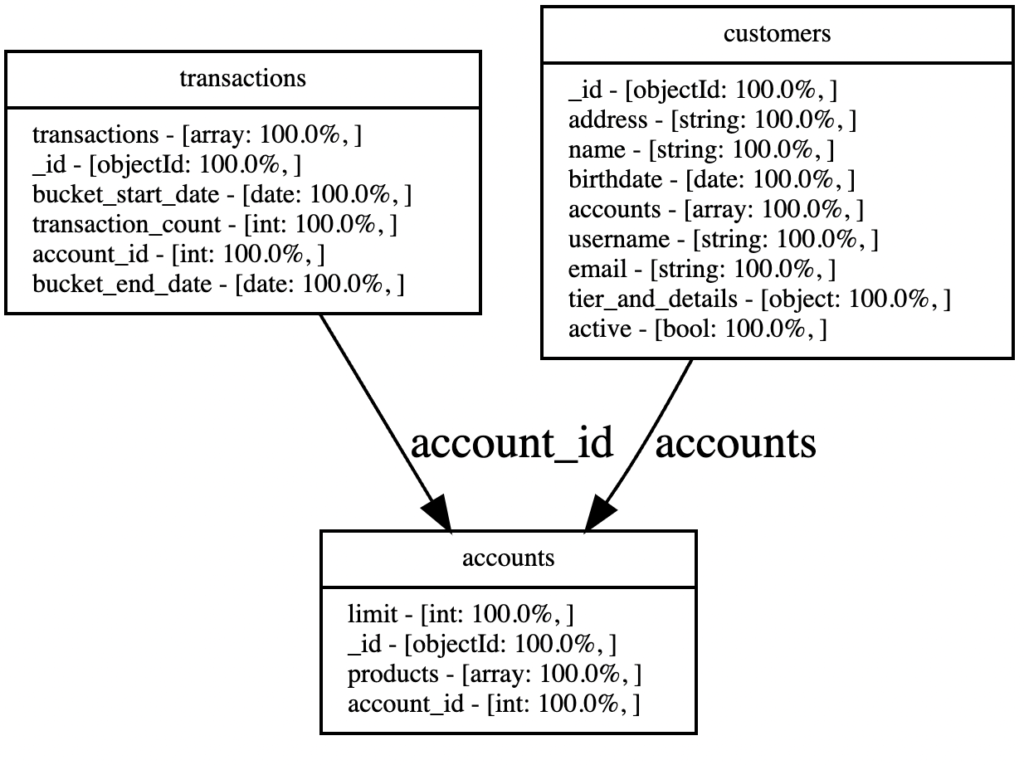
At this point we’re already able to list each collection, each field and the possible types of the field values:

Now we need to look into these fields and figure out which of the fields within a collection could be references to other collections. For that we will need to add some logic for the matching:
def linkFinder(value, collection):
        #filter links that match
        links=list(filter(lambda x: linkStrongChecker(value, x), collection_list))
        for link in links:
            #if the collection does not point to it self write it on .dot
            if collection!=link:
                file_object_dot.write('"'+collection+'" -> "'+link+'" [label="'+value+'"]\n')

def linkStrongChecker(key, collection):
    stemmer = Porter2Stemmer()
    keyAux=[]
    collectionAux=[]
    #compare the actual key/field value
    keyAux.append(key)
    #compare the actual collection value
    collectionAux.append(collection)
    #compare the key/field value with the string "_id" removed
    keyAux.append(key.replace("_id",""))
    #compare the key/field value with the string "Id" removed
    keyAux.append(key.replace("Id",""))
    #compare the collection value by removing plurals if they exist
    collectionAux.append(stemmer.stem(collection))
    #compare the key/field value by removing plurals if they exist
    keyAux.append(stemmer.stem(key))
    #for each combination of variations of key/field and collection names, see if there's match
    for testKey in keyAux:
        for testCollection in collectionAux:
            if testKey.lower()==testCollection.lower():
                return bool(True)
    return bool(False)
On these 2 functions we go through all the field names and compare them with the collection names:
- We compare both strings in lower case to see if they match
- We remove plurals from the strings and see if they match
- We remove “Id” and “_id” prefixes on the field names to see if they match with a collection name
Whenever we find a match we add it to our graphviz visualization
Finally we need to glue all these functions iterating through all the fields:
for i in collection_list:
    print("processing "+i)
    file_object_schema.write(i+"\n")
    result=get_keys(database, i)
    #start printing the collection
    file_object_dot.write('"'+i+'"[label="{'+i+'|')
    fieldMap={}
    #get the dictionary with all the fields and its possible types
    for field in result:
        if field['_id']['key'] in fieldMap:
            fieldMap[field['_id']['key']]['typeList'].append({"type":field['_id']['type'], "count":field['count']})
            fieldMap[field['_id']['key']]['totalCount']+=field['count']
        else:
            fieldMap[field['_id']['key']]={"typeList": [{"type":field['_id']['type'], "count":field['count']}]}
            fieldMap[field['_id']['key']]['totalCount']=field['count']
    # write to graphviz the fields the types the percentage each type appears for field
    for fieldKey in fieldMap:
        file_object_dot.write(fieldKey+' - [')
        for type in fieldMap[fieldKey]['typeList']:
            file_object_dot.write(type['type']+': '+str(round(type['count']/fieldMap[fieldKey]['totalCount']*100,0))+'%, ')
        file_object_dot.write(']\l')

    #close the collection in the graphviz file
    file_object_dot.write('}"]\n')
    #find and print all the possible links in the graphviz file
    for fieldKey in fieldMap:
        linkFinder(fieldKey, i)
#close the graphviz graph
file_object_dot.write('}\n')
# Close the file
file_object_dot.close()
It is time to run the script and convert the .dot file into an svg using graphviz:
python3 mongoSchemaAnalyser.py
dot -Tsvg relationshipsWTypes.dot >outputSimple.svg
Make sure to have graphviz installed to run the dot command. Here is the instructions page: https://graphviz.org/download/
Finally, here is the end result:

The script was able to automatically detect the relationship between customers and accounts: a customer may have multiple accounts. The script was also able to understand that each transaction was also related to accounts collection by the field account_id.
What do you think about this script, should we evolve it and publish it publicly? Let us know on the comments section.
