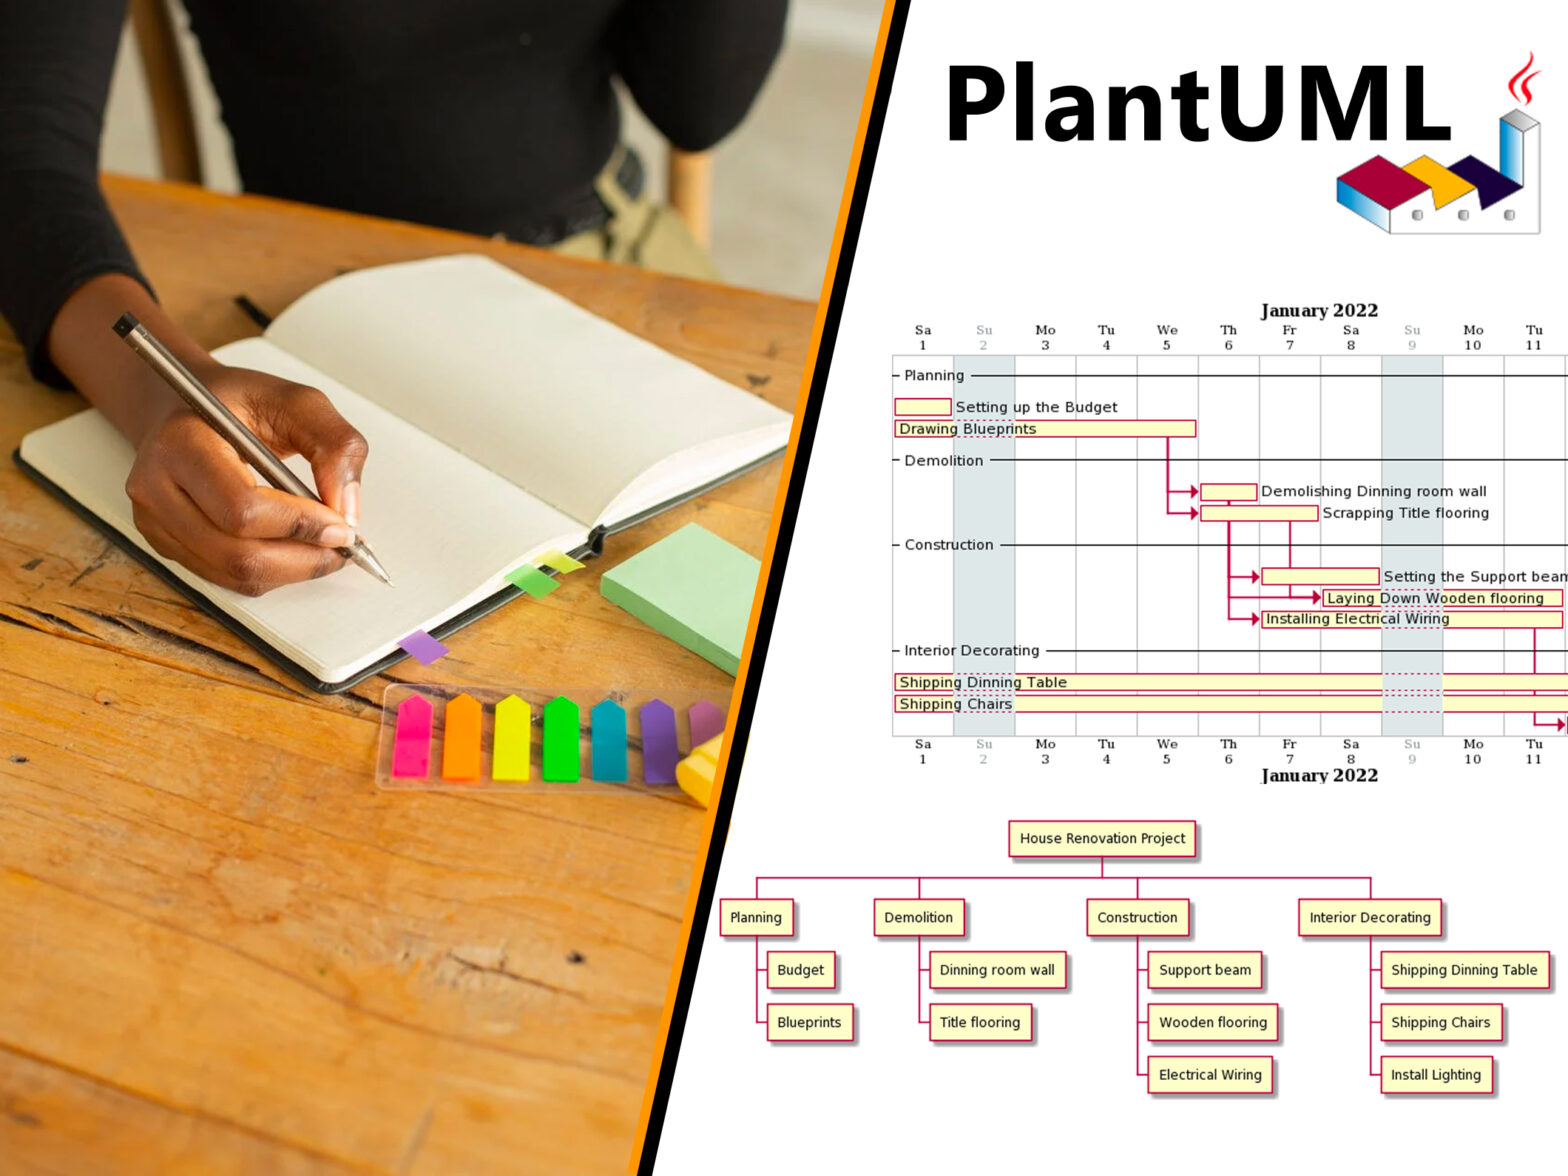
This weeks post will teach you how you can save time by converting your notes straight into a Work Breakdown Structure aka WBS and Gantts charts with PlantUML.
On the last couple weeks we looked into ways to use information mapping to improve communication. We have reviewed 3 Helpful Information Maps For Product Managers and also how we could Map out a MongoDB schema to improve our understanding about a Data Model, which is particularly interesting for Data Product Managers, or other data or application development focused roles.
On previous posts we mentioned tools like Graphviz and PlantUML and we listed some examples of diagrams produced with these tools. Today we will go deeper and understand how exactly can we use Plant UML to produce a WBS and a Gantt Chart.
What is PlantUML?
PlantUML is an open-source tool that allows users to create diagrams from a plain text. PlantUML supports a number of different types of diagrams:
- Project Management – WBS, Gantt Chart
- Business – Archimate, BPMN
- Software Development – UML, Computer Network, JSON Visualization, YAML Visualization
- General Information Mapping – Mind Map
- Other
PlantUML uses its own language to define the diagrams, which often very similar to how the diagrams would be described in natural language. This means you are likely already taking notes about these diagrams almost in a way that PlantUML is able to understand. Besides its own language, PlantUML also understands AsciiMath, Creole, DOT, and LaTeX.
PlantUML uses Graphviz under the hood to generate images that can be output as PNG, SVG, LaTeX and even ASCII art.
How can I use PlantUML?
PlantUML offers a number of integrations with text-editing software. There are plugins for Word, Google Docs, Confluence, Powerpoint, Visual Code and many more! In addition to all these integrations, you have the option to simply play with the tool using an online editor.
Find out more about the available here: https://plantuml.com/running.
Tutorial: WBS and Gantt charts with PlantUML
Installation
For this tutorial we used the Google Docs to create the diagrams. You can install the Add-On by clicking “Add-ons” from the document top menu and then “Get add-ons”:
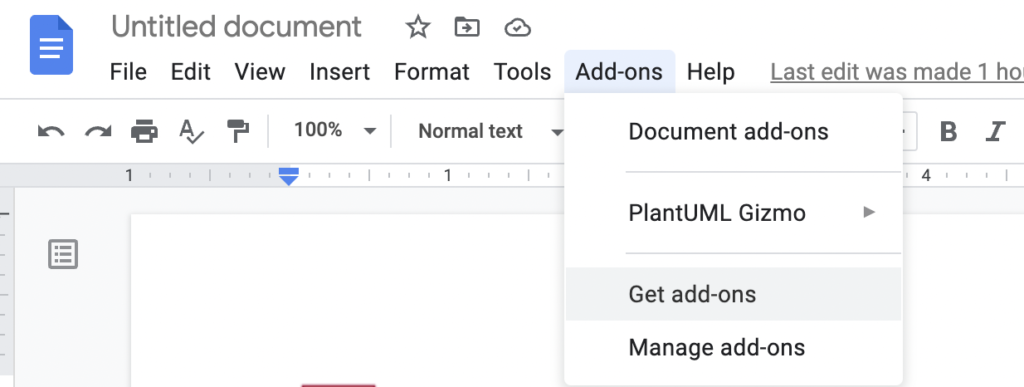
On the Get add-ons window search for “PlantUML Gizmo”, click “Enter” and then click “Install”

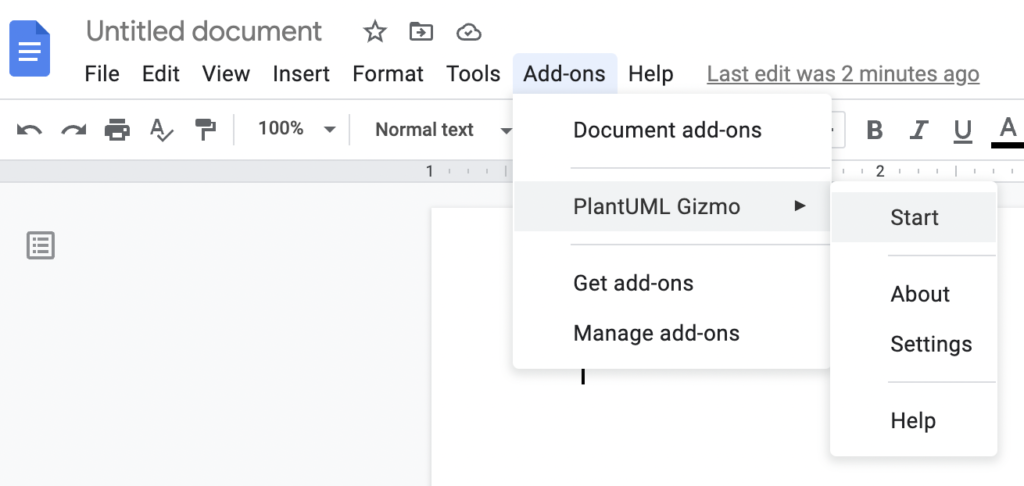
Start a PlantUML diagram by clicking “Add-ons” from the document top menu, select “PlantUML Gizmo” and then click “Start”:
WBS
Our “fake” project is a house renovation project. Here are our notes of what we want to achieve:
House Renovation Project TODO
- Planning
- Setting up the Budget
- Drawing Blueprints
- Demolition
- Demolishing Dinning room wall
- Scrapping Title flooring
- Construction
- Setting the Support beam
- Laying Down Wooden flooring
- Installing Electrical Wiring
- Interior Decorating
- Shipping Dinning Table
- Shipping Chairs
- Installing Lighting
Going from the notes above to a WBS in PlantUML is almost seamless, you just need to add “@startwbs” and “@endwbs” to the start and end of the todo list and convert the bullets into “*”:
@startwbs
* House Renovation Project
** Planning
*** Budget
*** Blueprints
** Demolition
*** Dinning room wall
*** Title flooring
** Construction
*** Support beam
*** Wooden flooring
*** Electrical Wiring
** Interior Decorating
*** Shipping Dinning Table
*** Shipping Chairs
*** Install Lighting
@endwbs
If we paste this into the “PlantUML source” text-area on the Google Docs add-on, it will magically spit-out a well formatted WBS:
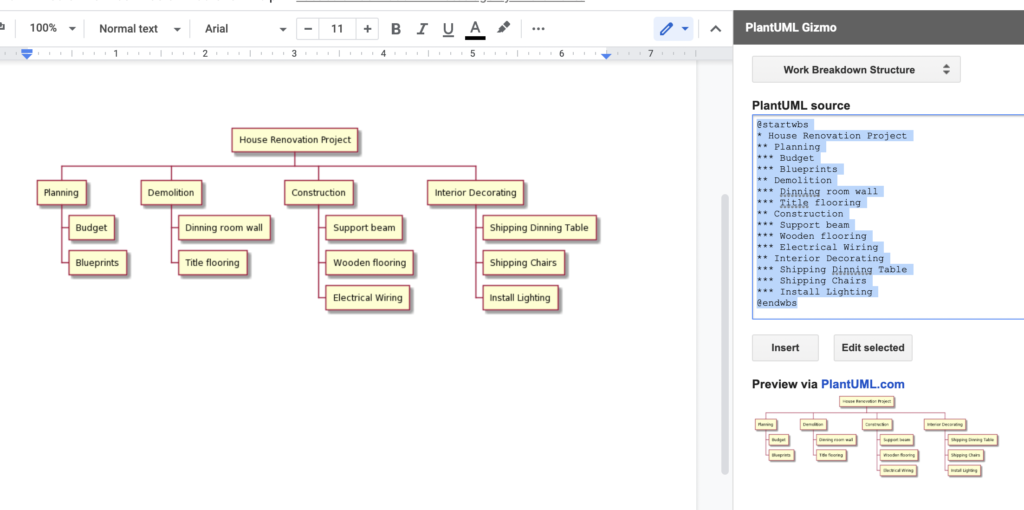
You can even tweak the look and feel of the diagram using text: https://plantuml.com/color. There’s even a set of preset themes you can use: https://plantuml.com/theme.
Think of all the time this saves you in comparison with a drag an drop drawing tool.
Gantt Chart
Let’s pick on the House Renovation project above. Let’s say we had a few more notes on the project:
House Renovation Project
- Project starts the 1st of January of 2022
- Sundays are rest days
- Planning
- Setting up the Budget lasts 1 day
- Drawing Blueprints lasts 4 days
- Demolition
- Demolishing Dinning room wall lasts 1 day
- Scrapping Title flooring lasts 2 days
- Construction
- Setting the Support beam lasts 2 days
- Laying Down Wooden flooring lasts 3 days
- Installing Electrical Wiring lasts 4 days
- Interior Decorating
- Shipping Dinning Table takes 10 days
- Shipping Chairs takes 10 days
- Installing Lighting lasts 1 day
Dependencies:
- Drawing Blueprints -> Demolishing Dinning room wall
- Drawing Blueprints -> Scrapping Title flooring
- Demolishing Dinning room wall -> Setting the Support beam
- Scrapping Title flooring -> Laying Down Wooden flooring
- Demolishing Dinning room wall -> Laying Down Wooden flooring
- Demolishing Dinning room wall -> Installing Electrical Wiring
- Installing Electrical Wiring -> Installing Lighting
From the notes above to a PlantUML diagram is just a small step:
@startgantt
projectscale daily zoom 3
Project starts the 1st of January of 2022
sunday are closed
-- Planning --
[Setting up the Budget] lasts 1 day
[Drawing Blueprints] lasts 4 days
-- Demolition --
[Demolishing Dinning room wall] lasts 1 day
[Scrapping Title flooring] lasts 2 days
-- Construction --
[Setting the Support beam] lasts 2 days
[Laying Down Wooden flooring] lasts 3 days
[Installing Electrical Wiring] lasts 4 days
-- Interior Decorating --
[Shipping Dinning Table] lasts 2 weeks
[Shipping Chairs] lasts 2 weeks
[Installing Lighting] lasts 1 day

[Drawing Blueprints] -> [Demolishing Dinning room wall]
[Drawing Blueprints] -> [Scrapping Title flooring]
[Demolishing Dinning room wall] -> [Setting the Support beam]
[Scrapping Title flooring] -> [Laying Down Wooden flooring]
[Demolishing Dinning room wall] -> [Laying Down Wooden flooring]
[Demolishing Dinning room wall] -> [Installing Electrical Wiring]
[Installing Electrical Wiring] -> [Installing Lighting]

@endgantt
Similarly to what we have seen the WBS we need to add “@startgantt” and “@endgantt”. Also the tasks need to be wrapped with “[]”. The rest is basically a copy paste from the notes.
Here’s the final Gantt Chart:
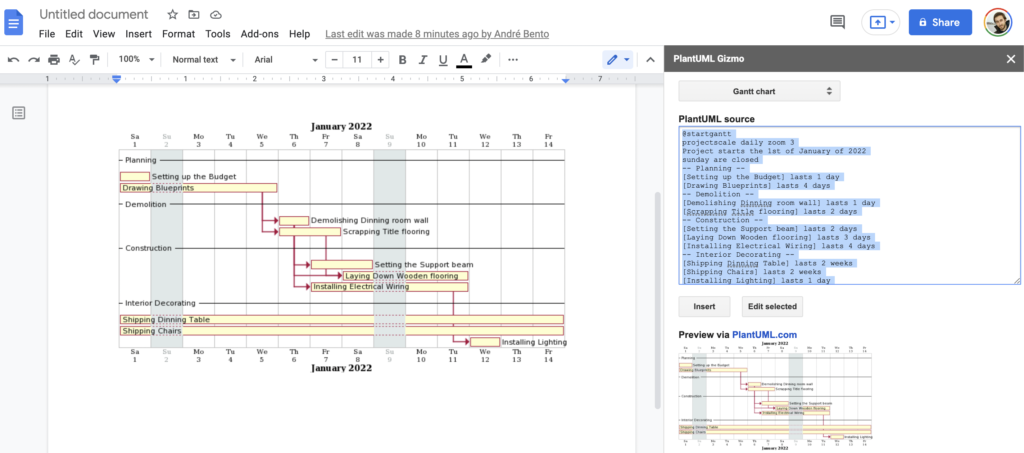
Note we added “projectscale daily zoom 3″ for the days to look wider making the diagram more readable. As for the WBSs there are options to tweak the look and feel of the Gantt Charts. You can find more information about how to tweak and extend this Gantt Chart example here: https://plantuml.com/gantt-diagram.
PlantUML is a great tool to quickly draw simple diagrams from text notes. It saves you the time and trouble of manually dragging and dropping boxes offered by most UI based tools.
Regardless if you are a Project Manager, a Product Manager or you are simply want to sketch a simple project PlantUML is a interesting option to shortcut the creation of diagrams.
